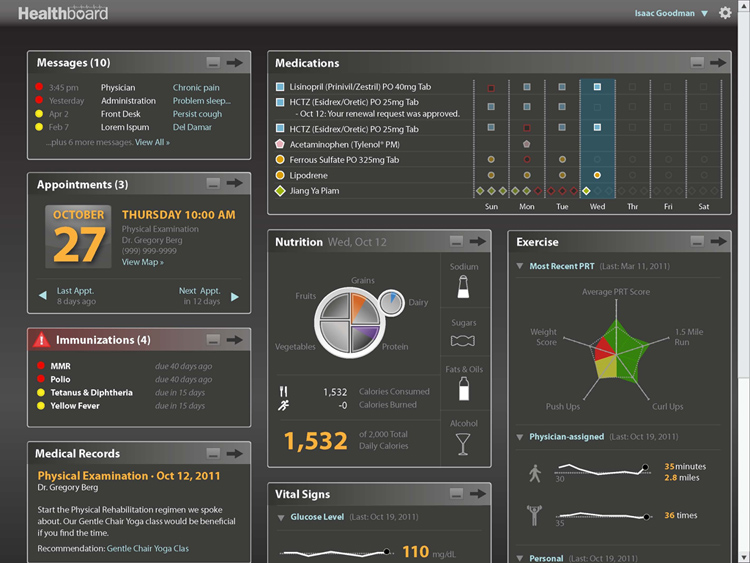
Clinical Data Visualization, Improving EMR Delivery and Usage

In recent years, there has been an increase in electronic medical records, personal health records, home monitoring devices, and other digital devices that generate digital health-related information. The development of these novel technologies also requires new ways to visualize data so that it can be used to identify patterns in the health of individuals as well as the population.
Clinical Data Visualization includes the presentation of captured data as well as the user interface to access that data. Data is captured in an electronic medical record by typing, speaking, scanning, or other input methods. Once the data is captured, the presentation and representation of the data helps to illuminate trends and patterns. These trends and patterns are then used by clinicians to take meaningful action to treat the patient.
Data stored in an EMR takes on many forms including text, numerical values, date ranges, wave forms, audio, video and images. Patients, clinicians, administrators and public health groups may require access to the information stored in an EMR. The interface used to access information is critical to the usability and acceptance of the EMR.
Electronic medical records offer the potential to improve patient care and enhance the efficiency of clinicians by making more data available when and where it is needed. At first glance, it is tempting to think that more data is better. However, sometimes it is possible to have too much of a good thing. Electronic medical record systems, physiological monitors and other medical devices generate large amounts of valuable data and make it possible to transmit that data to almost any clinician who needs it, anytime and anywhere. However, a clinician may only need a small subset of this data when caring for a particular patient. The challenge becomes to provide the necessary data and to display it as clinical information that allows the clinician to make correct and efficient decisions.
Access to healthcare data is an important issue for military health beneficiaries and caregivers. The increase of electronic record systems increases the complexity of accessing health data; therefore, a single simplified user interface has the potential to improve the delivery of healthcare. Access to and interpretation of medical data is critical to understanding trends in data for improved diagnosis, better healthcare delivery and understanding population health concerns.
The visualization of clinical data effort will help lay the foundation for clinical decision support tools by turning data into relevant clinical information.
This initiative will explore how to accomplish this in two ways; first, the information must be contextually relevant and second, the information must be displayed in a way that is easy for the clinician to interpret. Contextually relevant means that the application understands pertinent characteristics about the clinician-patient interaction and retrieves information that is specifically relevant to that interaction. The relevant information is then displayed to the clinician such that the most important information is prominent and can be interpreted quickly and correctly.
 An official website of the United States government
 ) or https:// means you've safely connected to the .mil website. Share sensitive information only on official, secure websites.


